Financial Highlights
Consolidated Financial Highlights
Fiscal years ended March 31
-
-
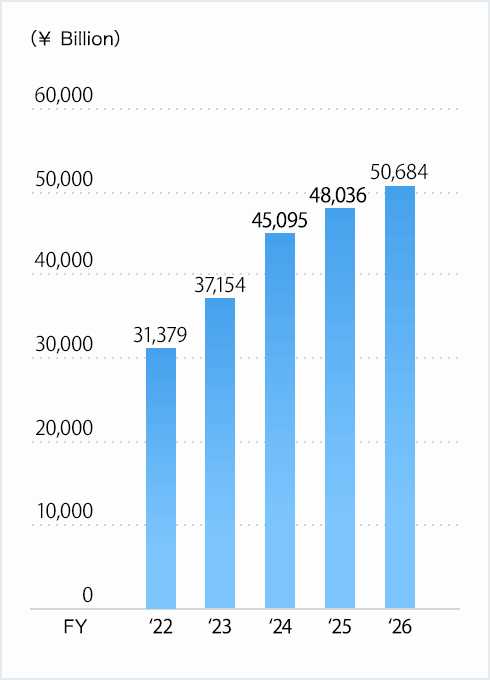
- Sales revenues
-
-
-
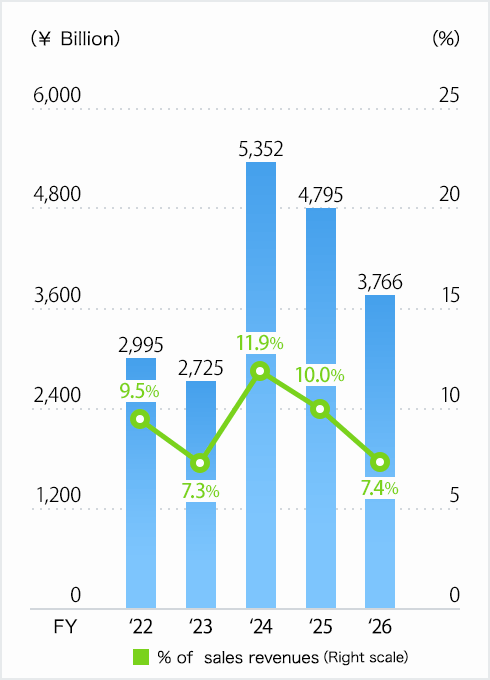
- Operating Income
-
-
-
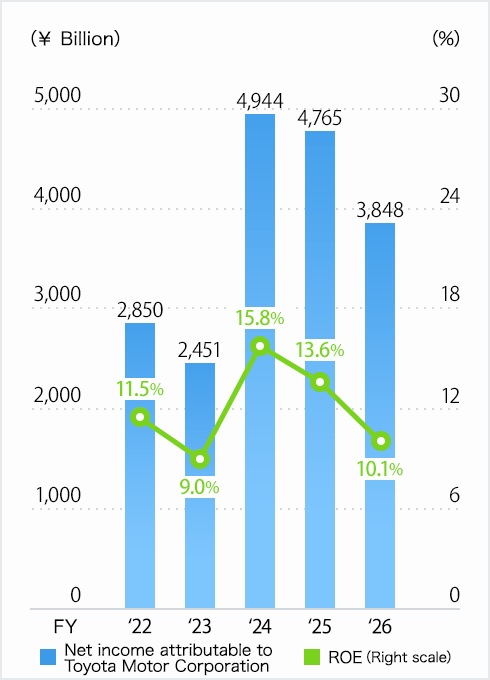
- Net income attributable to Toyota Motor Corporation and ROE (Return on Equity)
-
-
-
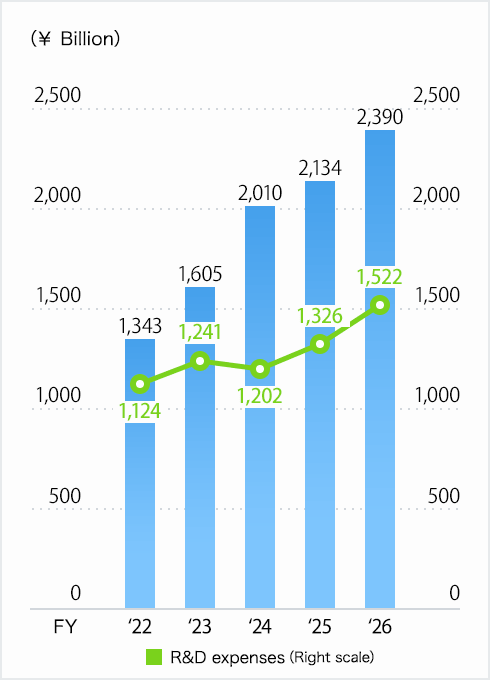
- Capital Investment* and R&D (Research & Development) Expenses
- *
- Excluding vehicles in operating lease or right of use assets
-
-
-
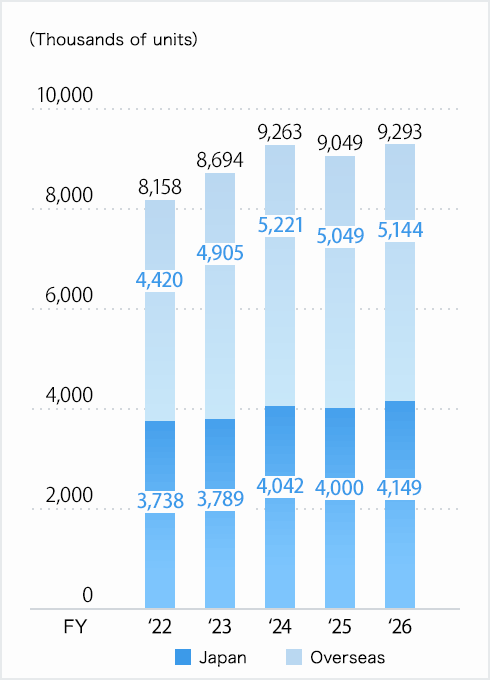
- Vehicle Production
-
-
-
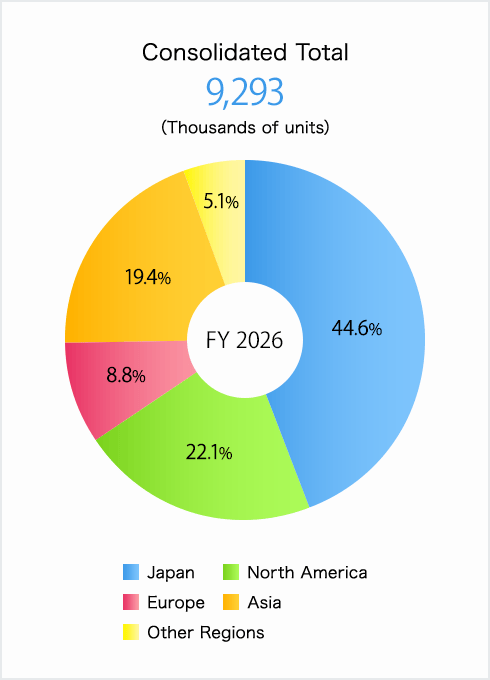
- Vehicle Production by Region
-
-
-
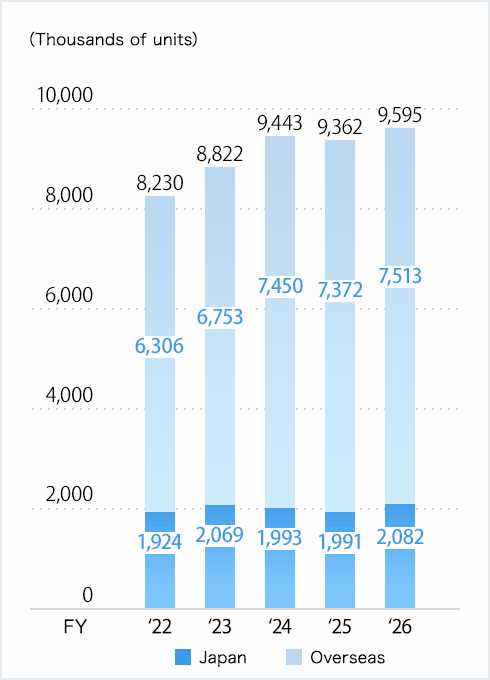
- Vehicle Sales
-
-
-
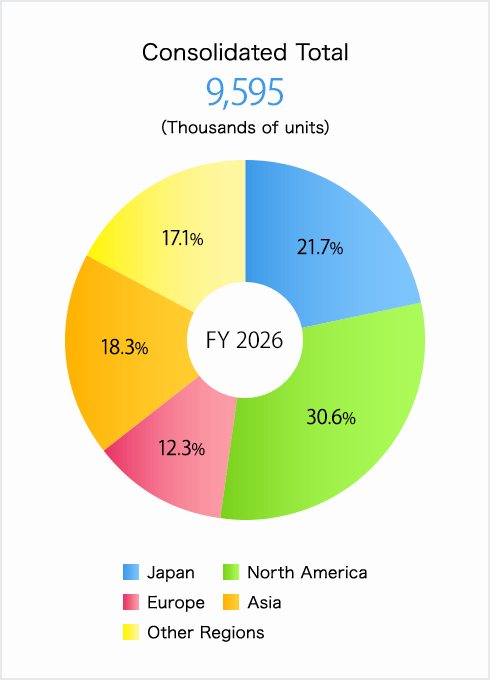
- Vehicle Sales by Region
-


Financial Performance (Consolidated)
| Fiscal Year | Financial Indicator | |||||
|---|---|---|---|---|---|---|
| Operating margin | Net margin from income before income taxes | Income before income taxes to total assets | Return on Assets (R.O.A.) |
Return on Equity (R.O.E.) |
Toyota Motor Corporation shareholders' equity ratio | |
| FY2026 | 7.4% | 10.2% | 5.2% | 3.9% | 10.1% | 37.8% |
| FY2025 | 10.0% | 13.4% | 7.0% | 5.2% | 13.6% | 38.4% |
| FY2024 | 11.9% | 15.4% | 8.5% | 6.0% | 15.8% | 38.0% |
| FY2023 | 7.3% | 9.9% | 5.2% | 3.5% | 9.0% | 38.1% |
| FY2022 | 9.5% | 12.7% | 6.1% | 4.4% | 11.5% | 38.8% |