Nov. 30, 2016
The History of Corolla Production Results (1966 - 2016.9)
The History of Corolla Production Results (1966 - 2016.9)
Total in Japan: 26million,
Total Outside of Japan: 18million
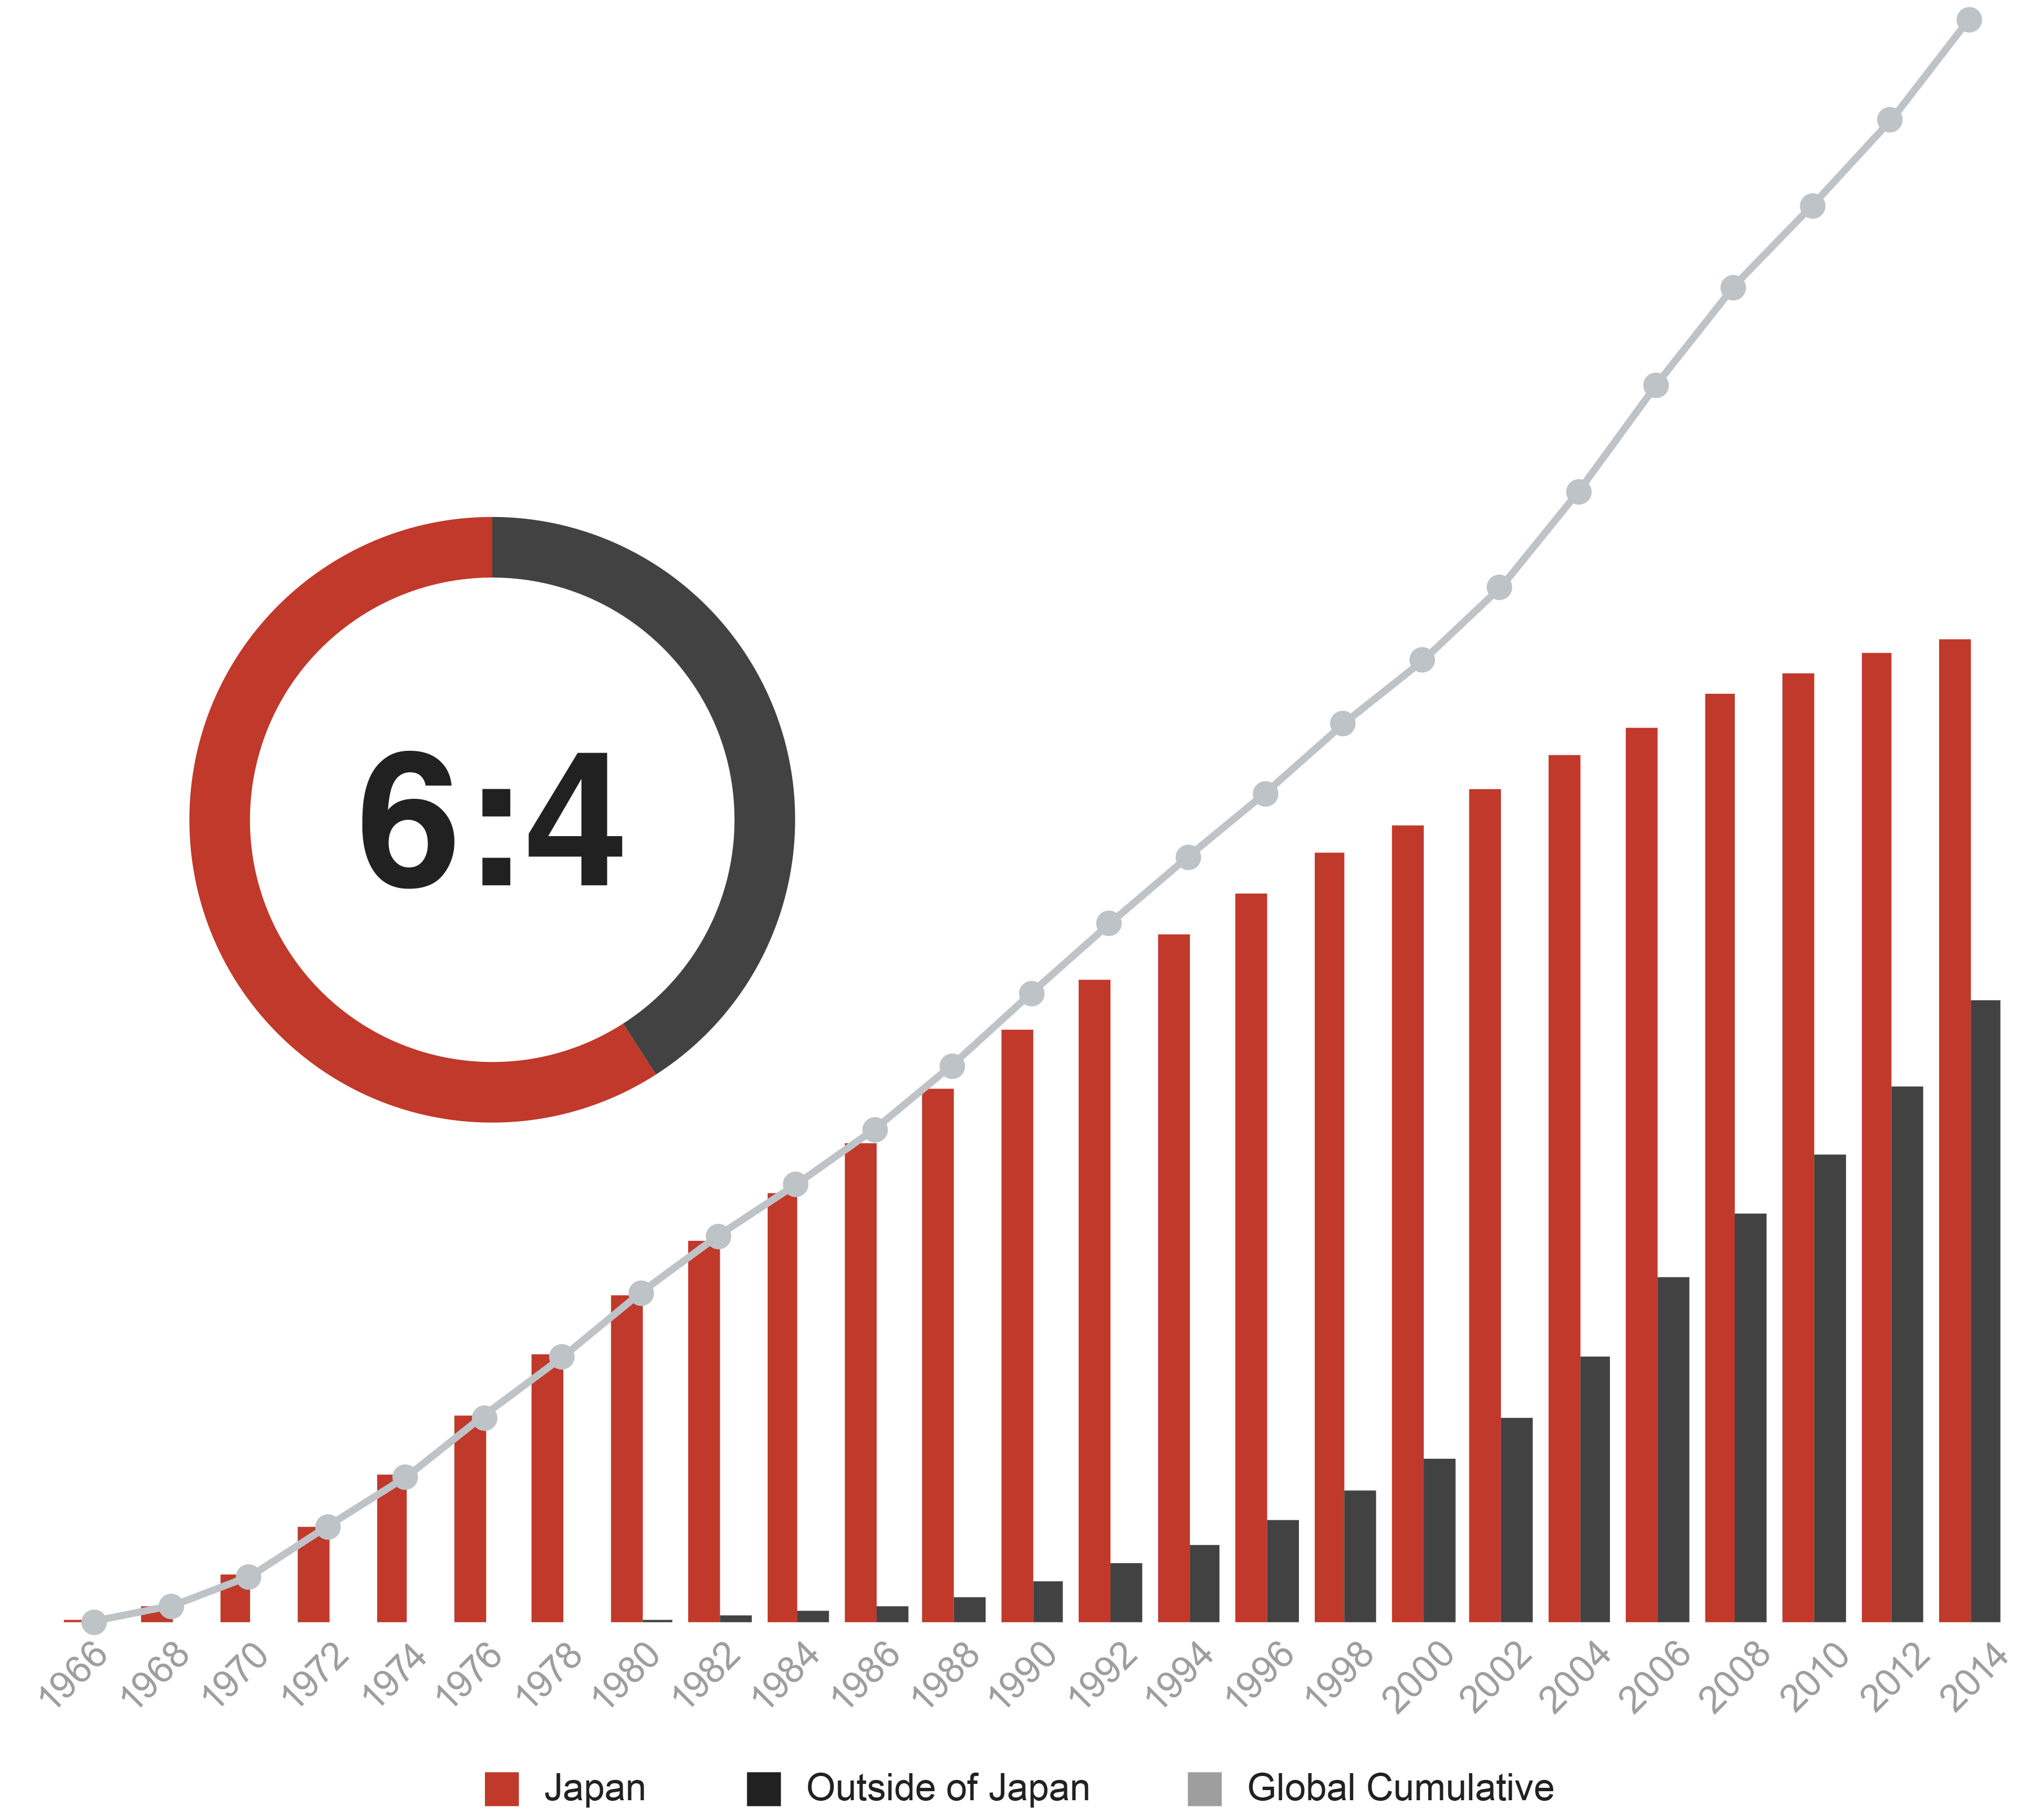
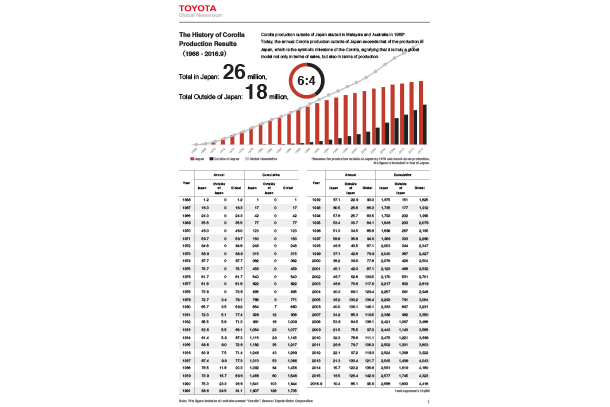
Corolla production outside of Japan started in Malaysia and Australia in 1968*. Today, the annual Corolla production outside of Japan exceeds that of the production in Japan, which is the symbolic milestone of the Corolla, signifying that it is truly a global model not only in terms of sales, but also in terms of production.

Because the production outside of Japan by 1978 was knock-down production, the figure is included in that of Japan.
| Year | Annual | Cumulative | ||||
|---|---|---|---|---|---|---|
| Japan | Outside of Japan | Global | Japan | Outside of Japan | Global | |
| 1966 | 1.2 | 0 | 1.2 | 1 | 0 | 1 |
| 1967 | 16.3 | 0 | 16.3 | 17 | 0 | 17 |
| 1968 | 24.3 | 0 | 24.3 | 42 | 0 | 42 |
| 1969 | 35.5 | 0 | 35.5 | 77 | 0 | 77 |
| 1970 | 46.0 | 0 | 46.0 | 123 | 0 | 123 |
| 1971 | 59.7 | 0 | 59.7 | 183 | 0 | 183 |
| 1972 | 64.8 | 0 | 64.8 | 248 | 0 | 248 |
| 1973 | 66.9 | 0 | 66.9 | 315 | 0 | 315 |
| 1974 | 67.7 | 0 | 67.7 | 382 | 0 | 382 |
| 1975 | 75.7 | 0 | 75.7 | 458 | 0 | 458 |
| 1976 | 81.7 | 0 | 81.7 | 540 | 0 | 540 |
| 1977 | 81.8 | 0 | 81.8 | 622 | 0 | 622 |
| 1978 | 73.6 | 0 | 73.6 | 695 | 0 | 695 |
| 1979 | 72.7 | 3.4 | 76.1 | 768 | 3 | 771 |
| 1980 | 85.7 | 3.5 | 89.2 | 854 | 7 | 860 |
| 1981 | 72.3 | 5.1 | 77.4 | 926 | 12 | 938 |
| 1982 | 65.5 | 5.8 | 71.3 | 991 | 18 | 1,009 |
| 1983 | 62.6 | 5.5 | 68.1 | 1,054 | 23 | 1,077 |
| 1984 | 61.4 | 5.9 | 67.3 | 1,115 | 29 | 1,145 |
| 1985 | 66.6 | 6.0 | 72.6 | 1,182 | 35 | 1,217 |
| 1986 | 63.9 | 7.5 | 71.4 | 1,246 | 43 | 1,289 |
| 1987 | 67.4 | 9.9 | 77.3 | 1,313 | 53 | 1,366 |
| 1988 | 78.5 | 11.8 | 90.3 | 1,392 | 64 | 1,456 |
| 1989 | 73.9 | 15.7 | 89.6 | 1,466 | 80 | 1,546 |
| 1990 | 75.3 | 23.3 | 98.6 | 1,541 | 103 | 1,644 |
| 1991 | 66.6 | 24.5 | 91.1 | 1,607 | 128 | 1,735 |
| 1992 | 67.1 | 22.9 | 90.0 | 1,675 | 151 | 1,825 |
| 1993 | 60.5 | 25.8 | 86.3 | 1,735 | 177 | 1,912 |
| 1994 | 57.8 | 25.7 | 83.5 | 1,793 | 202 | 1,995 |
| 1995 | 53.4 | 30.7 | 84.1 | 1,846 | 233 | 2,079 |
| 1996 | 51.3 | 34.5 | 85.8 | 1,898 | 267 | 2,165 |
| 1997 | 58.8 | 35.8 | 94.6 | 1,956 | 303 | 2,260 |
| 1998 | 46.6 | 40.5 | 87.1 | 2,003 | 344 | 2,347 |
| 1999 | 37.1 | 42.8 | 79.9 | 2,040 | 387 | 2,427 |
| 2000 | 38.2 | 39.6 | 77.8 | 2,078 | 426 | 2,504 |
| 2001 | 45.1 | 42.0 | 87.1 | 2,123 | 468 | 2,592 |
| 2002 | 46.7 | 62.8 | 109.5 | 2,170 | 531 | 2,701 |
| 2003 | 46.8 | 70.8 | 117.6 | 2,217 | 602 | 2,819 |
| 2004 | 40.3 | 89.1 | 129.4 | 2,257 | 691 | 2,948 |
| 2005 | 36.2 | 100.2 | 136.4 | 2,293 | 791 | 3,084 |
| 2006 | 40.0 | 106.1 | 146.1 | 2,333 | 897 | 3,231 |
| 2007 | 34.2 | 85.3 | 119.5 | 2,368 | 982 | 3,350 |
| 2008 | 53.6 | 84.5 | 138.1 | 2,421 | 1,067 | 3,488 |
| 2009 | 21.5 | 75.5 | 97.0 | 2,443 | 1,143 | 3,585 |
| 2010 | 32.3 | 78.8 | 111.1 | 2,475 | 1,221 | 3,696 |
| 2011 | 26.6 | 79.7 | 106.3 | 2,502 | 1,301 | 3,803 |
| 2012 | 22.1 | 97.2 | 119.3 | 2,524 | 1,398 | 3,922 |
| 2013 | 21.3 | 100.4 | 121.7 | 2,545 | 1,499 | 4,043 |
| 2014 | 15.7 | 120.2 | 135.8 | 2,561 | 1,619 | 4,180 |
| 2015 | 16.5 | 126.4 | 142.9 | 2,577 | 1,745 | 4,323 |
| 2016.9 | 10.4 | 85.1 | 95.6 | 2,588 | 1,830 | 4,418 |
1unit represents 10,000
Note: This figure includes all vehicles named "Corolla". Source: Toyota Motor Corporation


