Mar. 24, 2026
Aiming for Inclusive Participation Using the Process Simulator GEN-VIR®Adding Risk Visualization Features Useful Even During the Planning Stage, Process Improvement PART 6
At Toyota Motor Corporation's Frontier Research Center (hereinafter referred to as "Toyota"), as the company advances its transformation into a mobility company, we have been exploring solutions to the challenges posed by labor shortages and an aging workforce, which affect not only the automotive but also the construction industry. As part of this effort, we have collaborated with Obayashi Corporation (hereinafter "Obayashi") and other partners to develop and further enhance the process simulator "GEN-VIR®*1"*2-5. GEN-VIR aims not only to improve work efficiency but also to predict workers' physical fatigue (muscle fatigue) and potential workplace hazards at construction sites, with the goal of creating human-centered work processes. In this article, we introduce improvements to GEN-VIR's risk visualization features, as well as new functions that can be applied during process planning.
- We understand that GEN‑VIR can visualize risks based on the movements of workers and objects. Is that correct?
- Ogawa
- Yes. GEN-VIR was originally developed with the goals of improving work efficiency and providing muscle fatigue prediction for workers. Throughout that development, we also strengthened its capability to visualize exactly where risks are hidden within a workflow. In our article before last*4, we introduced the foundation of this risk visualization feature (Figure 1) and examples of how it was used in accident prevention. Specifically, we simulated actual work procedures and the movements of workers and objects so that workers could understand potential risks in advance.
-
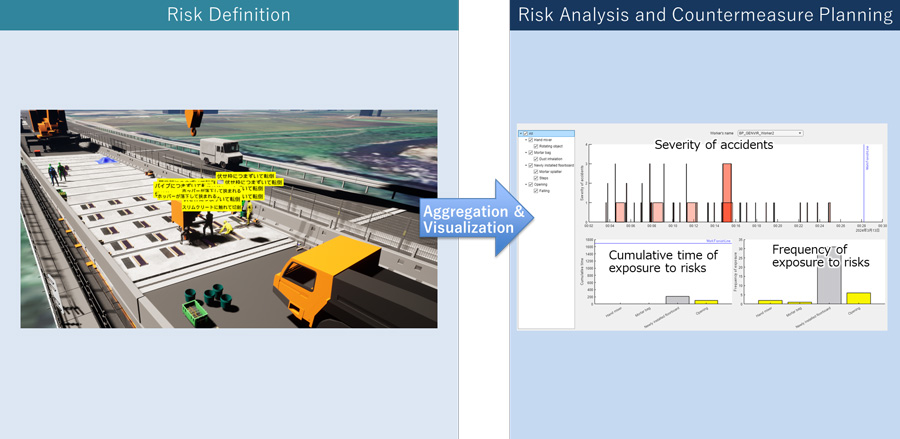
- Figure 1: Overview of the initial risk visualization features and analysis. The yellow callout above the worker (left) indicates risks associated with hazards, e.g., tripping over a pipe and falling.
- Being able to identify hazards right before construction is quite effective. What issues existed with the initial risk‑visualization features?
- Ogawa
-
At construction sites, a wide variety of workers work together―from experienced workers at Obayashi and its partner companies to those with little or no experience. We showed them simulations using the risk visualization function and gathered their feedback, which revealed the following issues:
- Hazardous areas were not intuitively recognizable
- The method of analyzing risks was difficult to understand
- Reviewing simulation results was cumbersome
- In some cases, risks were not entered at all
- I see. First, regarding the issue that hazardous areas were not intuitively recognizable, what new function did you add?
- Ogawa
- In this effort, we placed great importance on enabling users to instantly and visually grasp where risks are hidden. One such enhancement is the feature that makes hazardous areas flash. Previously, pop ups showing the hazard appeared above workers' heads, but users could not tell where the risk actually was. To resolve this, we implemented a feature that makes the hazardous area flash when a worker enters an area associated with a particular hazard source. We adjusted the color, flashing cycle, and number of blinks to achieve both high visibility and clarity (Video 1).
- Video 1: Hazardous area flashing
- It's very helpful to know which areas are hazardous. Next, you mentioned that you revised the risk analysis framework. What improvements did you make?
- Ogawa
-
The previous risk‑analysis approach had two major issues. The first was that indicators and evaluation criteria varied from site to site, causing assessments to rely heavily on the intuition and subjective judgment of individual staff members. This resulted in a lack of objectivity and consistency. The second issue was that the indicators used in past analyses were unfamiliar to site personnel, making the results difficult to interpret.
To address these challenges, we revised the system by referencing ISO frameworks and introduced a method for calculating risk levels and ranking them. Specifically, we now use four parameters―severity of the hazard, exposure time, avoidability, and probability of occurrence of the hazardous event―to evaluate the final risk level. This enables:
- Consistent analysis using the same criteria across different sites
- Clear identification of which risks should be prioritized for countermeasures
- Risk analysis tailored to each process and task
-
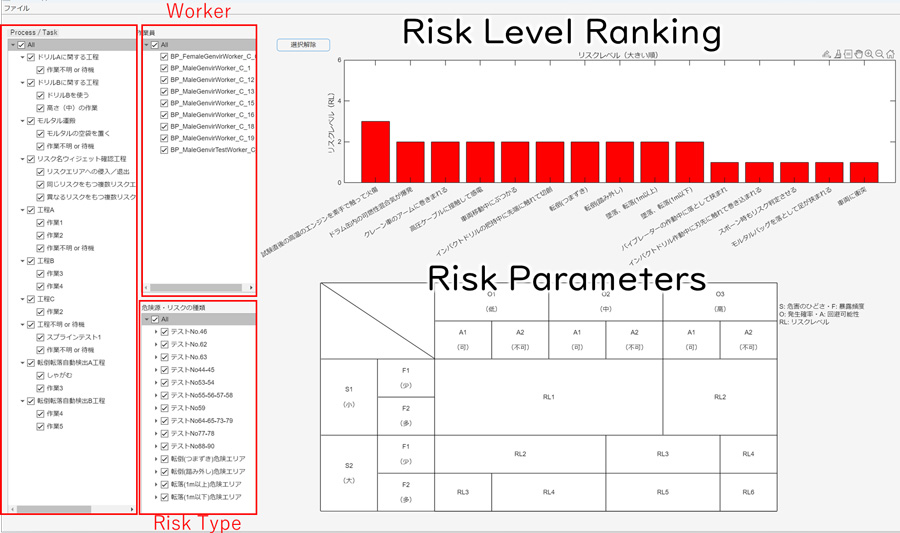
- Figure 2: Analysis based on risk levels
- Please tell us about the measures you took to address the difficulty of reviewing simulation results.
- Ogawa
-
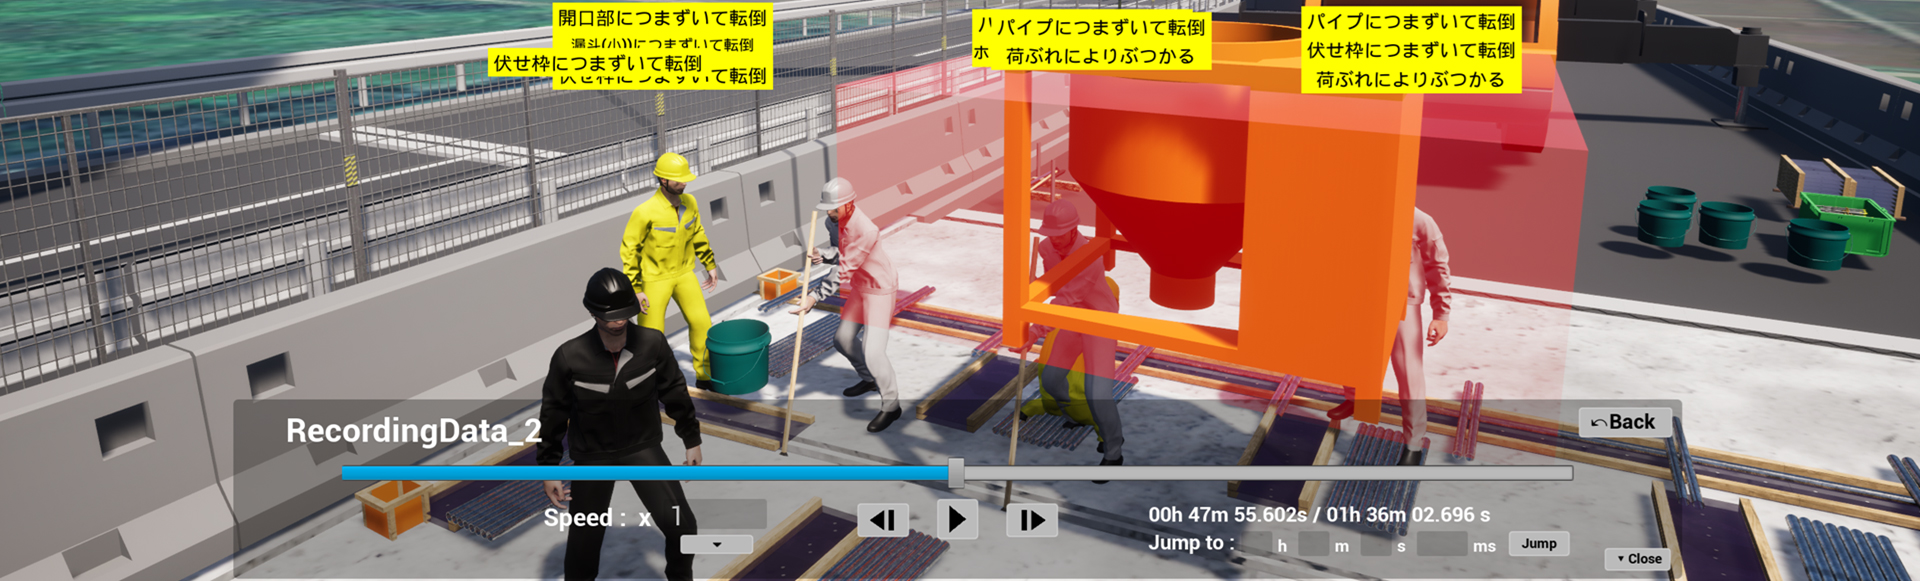
Until now, we had to predetermine the camera angles we wanted to review and record the simulation from those viewpoints before sharing the video. While using videos does allow reviewers to jump directly to the desired scenes, producing the videos requires time and effort. Furthermore, if reviewers wanted to see a different angle during the review process, they could not change the viewpoint, which was an inconvenience.
To resolve these issues, we developed a recording viewer feature. This feature records all movements within the simulation, allowing users to freely review the simulation at any timing and from any camera angle. With this, users can gain a bird's eye view, examine scenes that were previously in blind spots from different angles, or zoom in on specific details. Furthermore, the playback bar and speed adjustment functions make the review process smoother for all stakeholders involved (Video 2).
- Video 2: Simulation using the newly implemented feature
- Please tell us about the other improvements you made.
- Ogawa
- In addition to enhancing the risk visualization features, we also addressed the issue of missing risk settings during data entry.
- If risks are not set, workers cannot be alerted, which is extremely dangerous. How did you address this problem?
- Ogawa
-
Previously, GEN-VIR users had to manually set hazardous areas, which made input omissions more likely.
Since fall and trip hazards occur frequently and can lead to serious accidents, omissions cannot be permitted. To address this, we implemented a system that automatically detects fall and trip risks based on height differences between workers and their surrounding environment (Figure 3, Video 3). In addition, because the system can calculate the duration of exposure to fall or trip hazards, it now enables more realistic and accurate risk assessments. Although this initiative focuses on falls and trips, we plan to expand automatic detection to other types of hazards in the future.
-
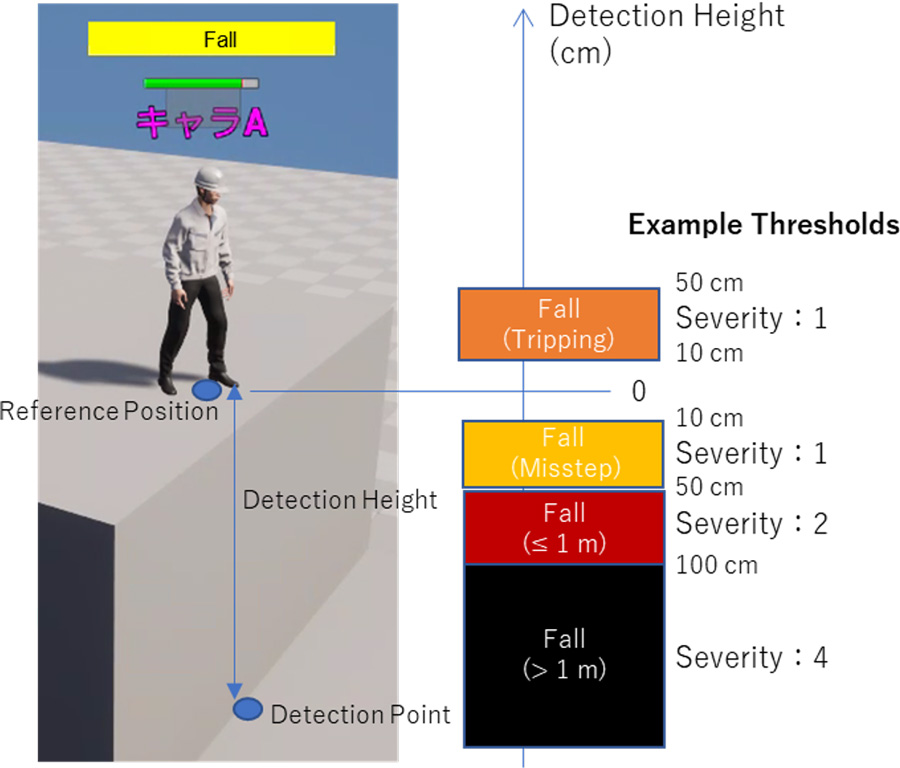
- Figure 3: Risk detection image based on height differences
- Video 3: Detecting height differences
- Ogawa
- We hope that the improvements implemented so far will help encourage discussions at construction sites.
- So GEN-VIR is a tool that enables everyone on site to share a common understanding and deepen discussions. Did you make any specific efforts to encourage more workers to use the improved features?
- Ogawa
- Yes. To ensure that the newly introduced risk visualization technology would be widely used, we believed it was important not only to explain the features but also to let workers experience examples of how the technology could be used on actual sites. For this reason, we conducted an "improvement demonstration" that simulated a real construction project―the floor slab replacement work on the Miyagi Matsukawa Bridge on the Tohoku Expressway.
- We heard that in this improvement demonstration, you not only provided hands-on experience but also proposed new ways of utilizing GEN-VIR.
- Ogawa
- That's right. For some time, we have believed that if as many risks as possible could be identified during the process planning stage, much safer process planning could be conducted. Process planning is an essential phase in which the procedures and layout for the entire construction project are determined. If risks can be identified during this stage, safety can be improved by reviewing the work itself or by changing the task sequence.
- It's certainly difficult to change the entire process once construction has already begun.
- Ogawa
- In the improvement demonstration, we asked workers to review simulation results for both the conventional work schedule and an improved schedule incorporating risk-reduction measures (Figure 4).
-
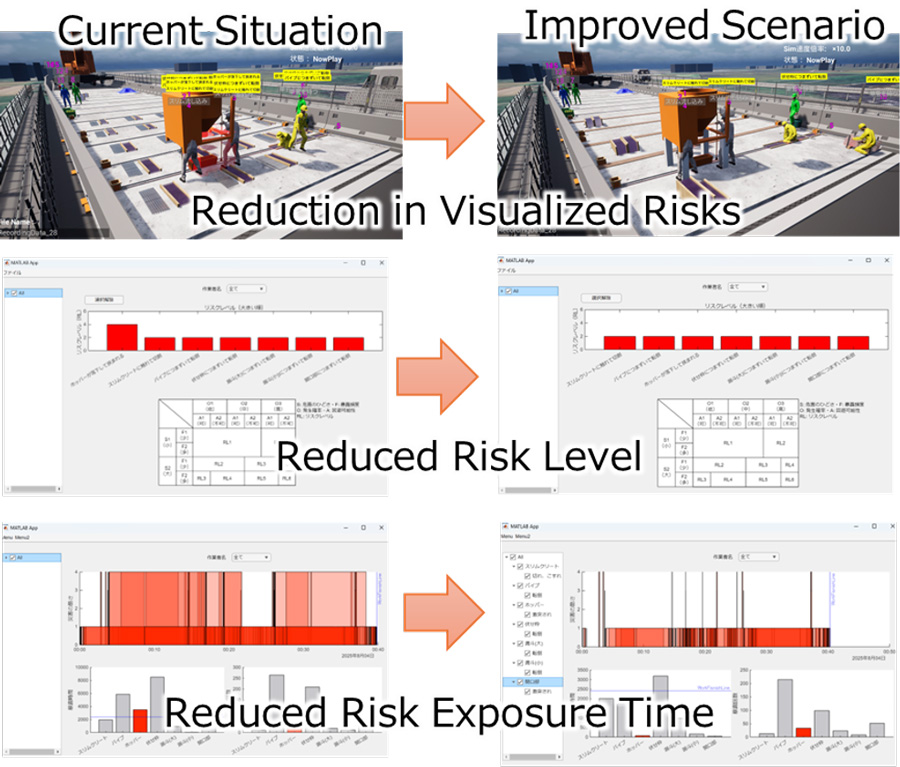
- Figure 4: Conventional work schedule (current) and improved schedule considering risk reduction
- By comparing actual project schedules, workers were able to experience how identifying more risks during the planning stage can lead to safer process planning.
- Ogawa
-
Yes. Through the simulations, workers highly valued the ability to visualize risks during the planning stage. Specifically, we received the following comments:
- It is effective to identify combined risks that occur when multiple hazardous areas overlap.
- Quantitative information such as exposure time to each risk enables safer process planning.
- Finally, how do you hope to apply these efforts going forward?
- Ogawa
- We have begun to see a new approach to work―one that incorporates safety considerations from the process planning stage. Moreover, we believe that this system can be applied not only to civil engineering but also to many other fields, such as architecture, manufacturing, and plant operations. Discussions have already begun regarding its use in our in-house factories, and we expect it to be adopted in even more workplaces. We will continue collaborating with on-site personnel as we further develop this technology to help create workplaces where anyone can work comfortably.
-
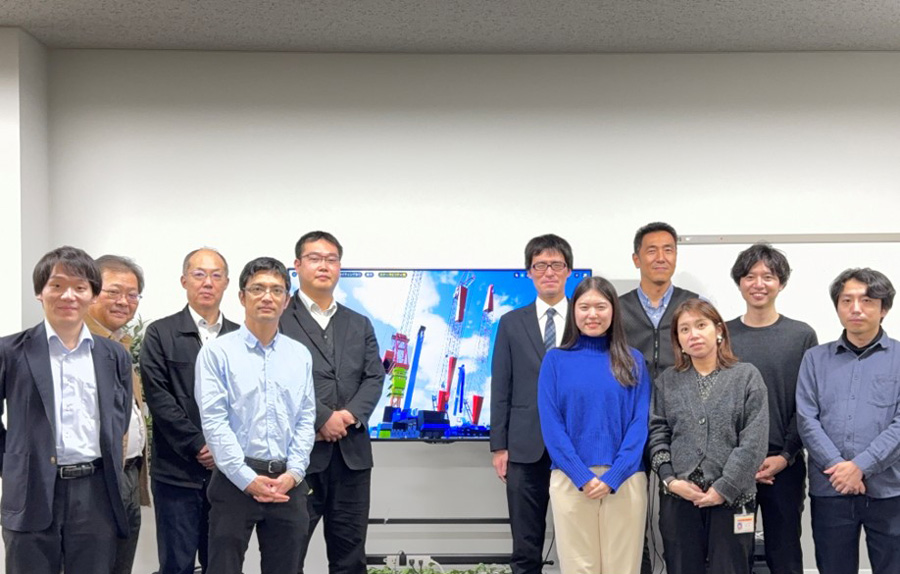
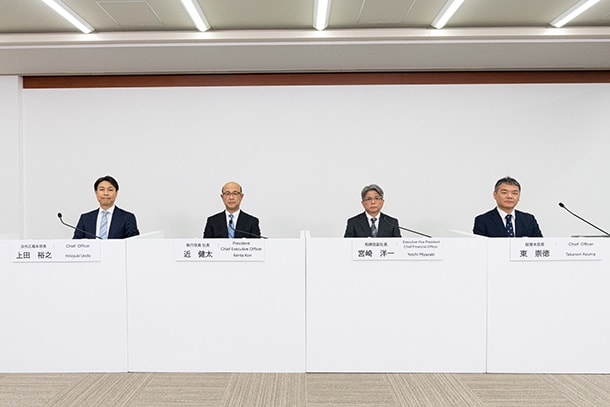
- Figure 5: Project team members (author is second from the right)
Extra Section: Award Highlights
Award at the 2025 Infrastructure DX Competition
-
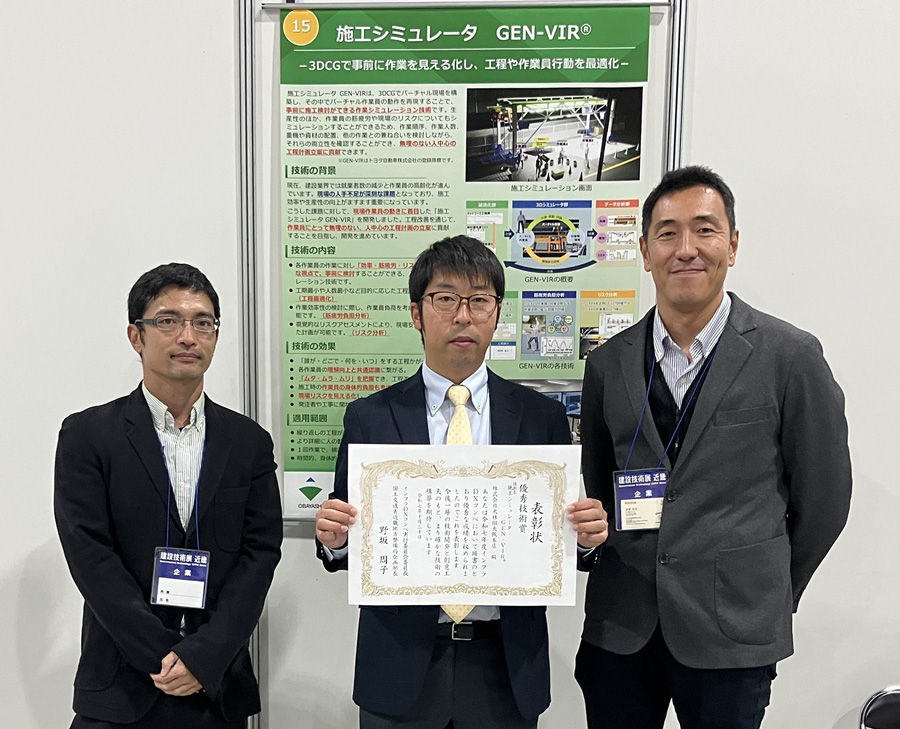
- Figure 6: Scene from the award ceremony at the Infrastructure DX Competition
In October 2025, Obayashi Corporation received the Excellence Technology Award at the "2025 Infrastructure DX Competition," hosted by the Kinki Regional Development Bureau of the Ministry of Land, Infrastructure, Transport and Tourism (MLIT). The award recognized Obayashi's DX initiatives at construction sites using the GEN-VIR process simulator, including technologies such as virtual environment utilization, risk visualization, and workload analysis, which contributed to improved productivity and safety on site.
-
- Figure 6: Scene from the award ceremony at the Infrastructure DX Competition
Presentations at the 2025 Annual Meeting of the Japan Society of Civil Engineers
-
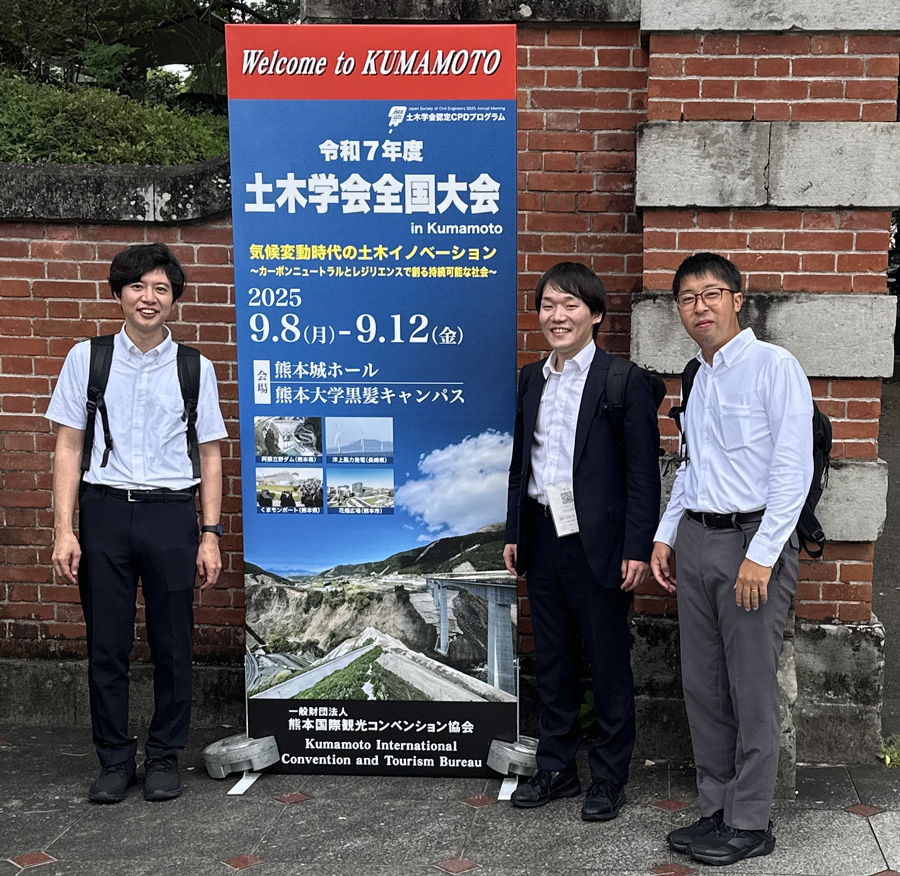
- Figure 7: At the venue of the Japan Society of Civil Engineers Annual Meeting
On September 12, 2025, at the 80th Annual Academic Lecture Meeting of the Japan Society of Civil Engineers, several presentations related to construction process improvement using simulation technology were delivered:
- "Process Improvement using Construction Simulator (Part 1)
- Development of Simulation Technology considering Worker Muscle Fatigue -" by Daisuke Kawahara et al. - "Process Improvement Using Construction Simulator (Part 2)
- The Effectiveness of 3DCG and Quantitative Risk Data in Construction Sites -" by Yuta Ogawa et al. - "Process Improvement Using Construction Simulator (Part 3)
- Extraction of Tool Operation Time Periods through Single Tool Sound Analysis -" by Takuro Inohara et al.
In addition, Takuro Inohara received the "JSCE Annual Meeting Outstanding Presentation Award," an award presented to young researchers and engineers who are expected to lead the future of the civil engineering field.
-
- Figure 7: At the venue of the Japan Society of Civil Engineers Annual Meeting
Author
Yuta Ogawa
Joined in 2017. Engaged in this project since 2023, responsible for the design and evaluation of GEN-VIR.
References
| *1 | A process simulator jointly developed by Toyota Motor Corporation and Obayashi. Based on Toyota's concept of "genba-genbutsu," it aims to improve work processes in a virtual environment and evolve to create human-centered processes. GEN-VIR is a coined term combining "GEN," the Japanese reading for "on-site," and the first three letters of "virtual." It is a registered trademark of Toyota Motor Corporation. |
|---|---|
| *2 | Using Simulation to Improve Conditions for Construction Workers - Reducing Construction Time through Kaizen PART 2 - |
| *3 | Developing a Construction Simulator That Can Be Used by Anyone for Any Process - Construction Kaizen to Improve Conditions for More Construction Workers PART 3 - |
| *4 | Making a Better Ever Processes! Virtual On-site Replication with Process Simulator Risk Visualization and Process Optimization |
| *5 | Researching Better Processes Using the Process Simulator GEN-VIR® - Improving the Accuracy of Worker Muscle Fatigue Prediction Technology: Construction Kaizen Part 5- |
Contact Information (about this article)
- Frontier Research Center
- frc_pr@mail.toyota.co.jp
RELATED CONTENT
MOST POPULAR