Oct. 25, 2024
Development of a Badge System to Visualize Communication States
Toyota Motor Corporation's Frontier Research Center (hereafter referred to as Toyota) and the Toyota Central R&D Labs., Inc. (hereafter referred to as TCRDL) are working on visualizing communication through conversation using sensing data, with the aim of enhancing the vitality of individuals and organizations. This project emphasizes theoretical research and the pursuit of value, focusing on real-world experiments in settings like internal training and workplaces. In this article, would like to share the details of this initiative.
- First, could you tell us about the background of starting this project?
- Mitsuda
Yes. At the beginning of the project, we wanted to use mathematical and data science to solve everyday problems in life and work. We therefore launched a project to create new value for the future by solving familiar problems.
The theme we focused on is communication through direct dialogue. In modern society, values and choices are diversifying, so that broadening perspectives through direct dialogue is increasingly important. However, many people struggle with effective speech and empathy.
We believed that by objectively and quantitatively understanding the state of communication through data, we could gain multi-faceted insights that would improve the vitality and growth of individuals and organizations.
- It would be amazing to visualize invisible communication. What specific technology did you use?
-

-
Figure 1. The Badge Developed by Toyota
We developed it based on MIT Media Lab's Open Badges to collect data from around 100 participants.
- Mitsuda
- Other organizations already have ongoing studies, such as Business Microscope®*1 by Research & Development Group of Hitachi, Ltd., and MIT Media Lab's Open Badges*2*3, which is made available under an open-source license. These involve wearable sensors that hang around the neck and visualize communication information (non-verbal signals), such as conversation volume, timing, physical distance to the conversation partner, body movements, and nodding. Since these sensors are small, subjects can continue natural communication without being aware of the data collection. We modified the MIT Media Lab's Open Badges so that we could collect data from around 100 participants. We will refer to the Open Badges we developed as "Badge" (Figure 1) and the entire data collection, analysis, and visualization functionality as the "Badge System."
-

-
Figure 1. The Badge Developed by Toyota
We developed it based on MIT Media Lab's Open Badges to collect data from around 100 participants.
- What kind of experiments did you conduct using the Badge System?
- Mitsuda
The challenge and interesting point is how to extract useful information in the field from the simple data of the sound pressure of the subject's voice and the body acceleration data obtained from the Badge. For example, while analyzing sound pressure data, the quantity of conversation often draws attention, but silence can also be an important indicator, depending on the situation.
To specify the indicators and validate their value, we visited workplaces where people faced problems, had them use the Badge System for a certain period, and collected their feedback. We focused on the characteristics of individuals and groups, introducing a case study on group work in internal training (conducted by Toyota) as an example focused on individuals and a case study on everyday workplace applications (conducted by TCRDL) as an example focused on groups.
- Now, could you tell us about the case study on applying the Badge System to group work in internal training, focusing on the issues at the site?
- Sugata
In this internal training, there is one instructor for about 20 participants, who are divided into groups of four or five to discuss their mindset about work. Since the instructor is an employee and not a professional evaluator, there are limitations to evaluating each participant carefully and objectively.
So, we had the participants wear the Badges during group work. We analyzed the sound pressure and acceleration data collected from the Badges and created communication analysis reports for each participant, as shown in Figure 2. We developed 11 indicators to evaluate participants from multiple perspectives.
-
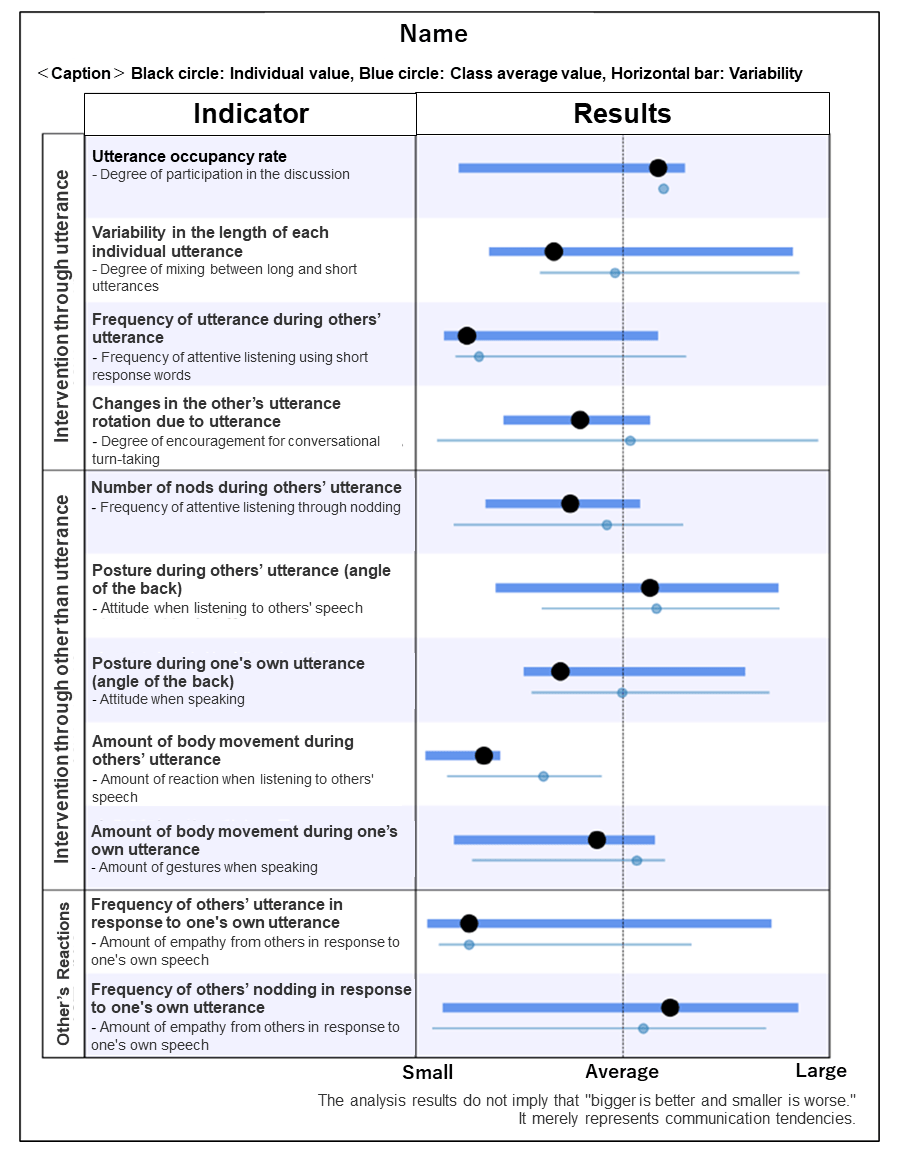
- Figure 2. Communication Analysis Report
- Were there any difficulties in determining the communication indicators?
- Sugata
- Understanding the instructor's perspective was challenging. For example, it was difficult to verbalize how the instructor viewed the participants regarding the evaluation item "Do you respect the other person?" and translate that into a quantitative indicator. As a result, we set indicators for the number of nods during others' speech, speech occupancy rate, and posture during spontaneous speech.
- How was the feedback on the communication analysis report?
- Sugata
- Not only when the instructor advises participants but also by presenting this report to the participants' workplace supervisors, we were able to provide an objective explanation of the participants' communication tendencies. This aspect has been very well received and has significantly contributed to improving the participants' communication skills.
- Next, please tell us about the case study conducted at TCRDL, focusing on the group.
- Nagaya
- Yes. At TCRDL, to visualize daily communication in the workplace, we had about 100 employees in the administrative department wear the Badges for about three months, collected communication data during work hours, and visualized the data for two months that were analyzable.
- What kind of visualization did you perform?
- Nagaya
- For example, based on the conversation time between pairs of individuals, we created and analyzed a communication network. Figure 3 shows the communication network based on all conversations that occurred over the two months. Each circle represents one person.
-
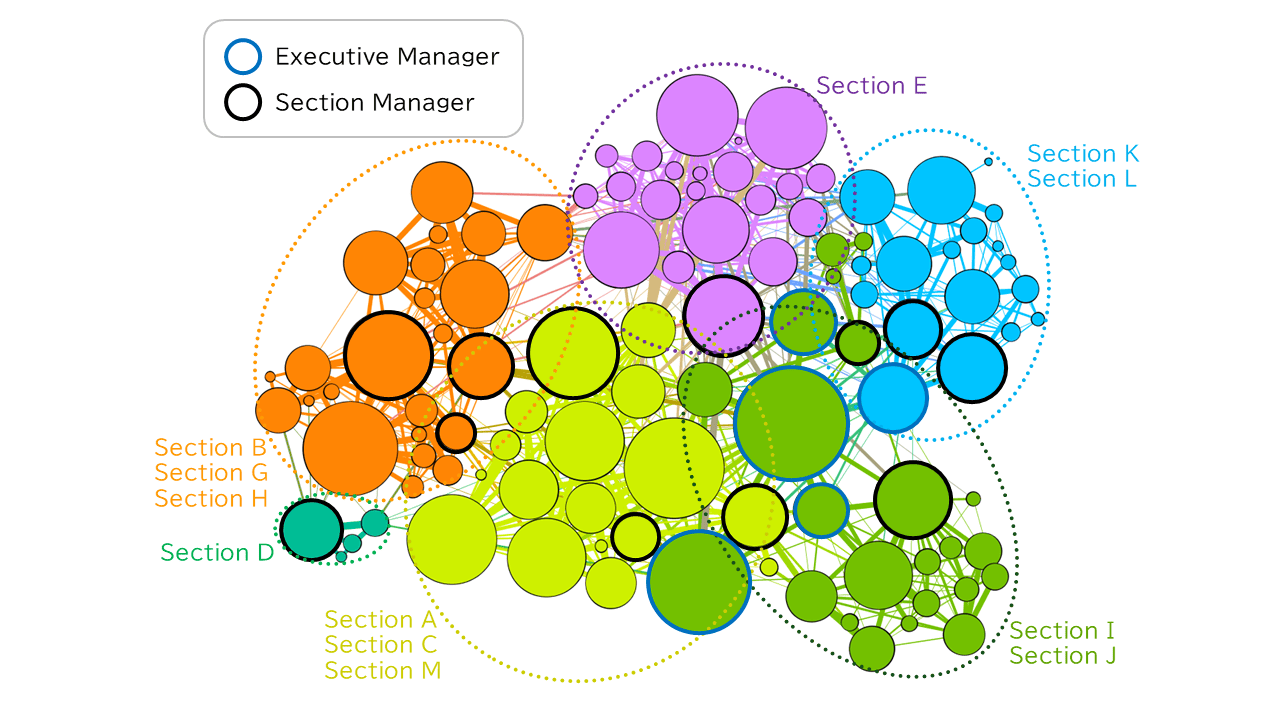
- Figure 3. Communication Network over Two Months
Circle Diameter: Speech Time, Line Thickness: Conversation Time Between Two Individuals, Color: Clustering Result
- Nagaya
- From this communication network, we calculated indicators used in social network analysis, such as "betweenness centrality," which shows who is mediating information between workplace communities. Figure 4 illustrates the changes in betweenness centrality over time. The left side shows the first month, and the right side shows the second month. The orange arrows in the figures indicate that a certain person's betweenness centrality was overwhelmingly high in the first half of the experiment but blended with other managers in the second half.
-
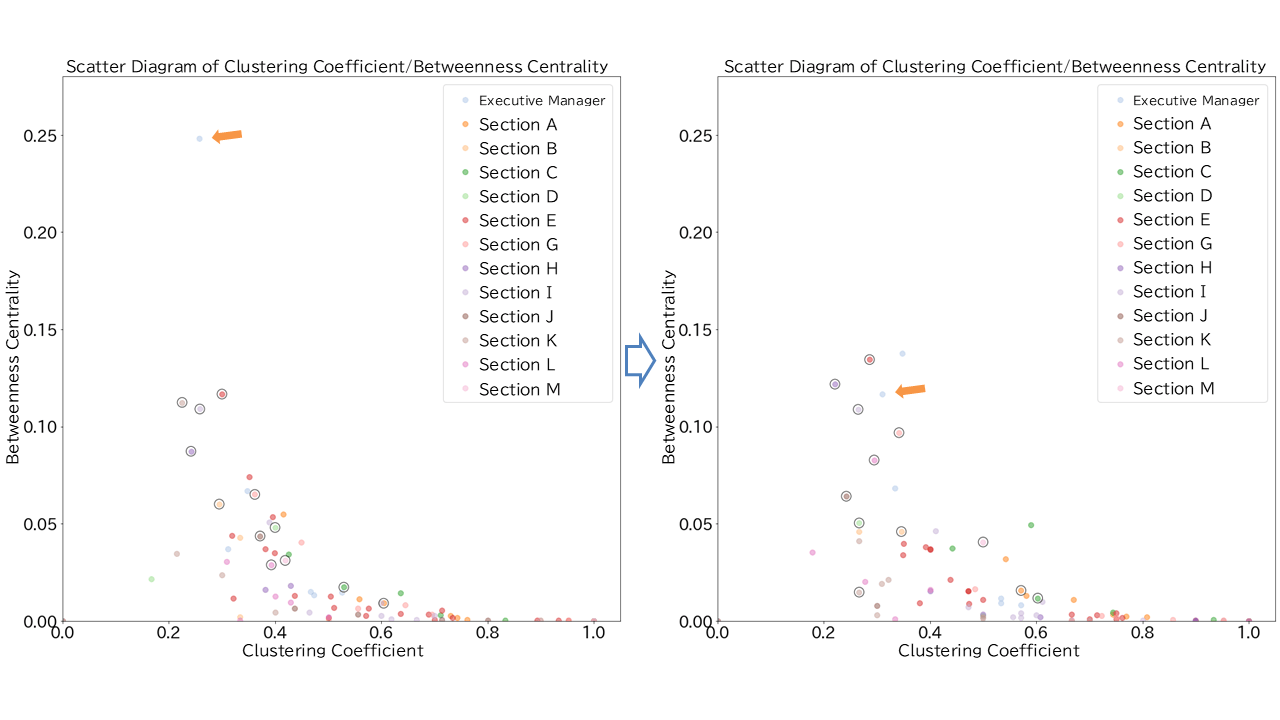
- Figure 4. Changes in Betweenness Centrality (Left: First Month, Right: Second Month)
Vertical Axis: Betweenness Centrality, Horizontal Axis: Clustering Coefficient, Color: Affiliated Organization, Circle: Managers of Each Section
- What changed?
- Nagaya
- The communication networks for each period are shown in Figure 5. From Figure 5, we can see that a new community (in blue) emerged in the second half, including the individual with high betweenness centrality, indicating that this community is acting as a new mediator of information. We could say that the pathways through which information flows have diversified.
-

- Figure 5. Changes in Communication Network (Left: First Month, Right: Second Month)
Circle Bordered in Orange: Individual indicated by the arrows in Figure 4
- I see, it seems we've gained insight into group communication. What other visualizations were performed?
- Nagaya
- We conducted a detailed analysis of communication within meeting rooms. In regular conversations, it can be difficult to determine what constitutes a continuous conversation, but in meetings held in meeting rooms, it is relatively clear when the conversation starts and ends. At TCRDL, we can check everyone's schedules on Outlook, so with the participants' consent, we obtained scheduled data and linked it with conversation data. Over two months, we extracted and analyzed more than 3,000 meetings and discussions.
- Even within conversations held in meeting rooms, there are various types, such as formal meetings, team discussions, and casual chats. In what situations would this be useful?
- Nagaya
- Actually, that was our concern. After some trial and error, we concluded that one-on-one conversations between managers and members would be ideal. Therefore, we extracted meetings explicitly titled "1-on-1" in the scheduler. Figure 6 shows the analysis results of four such one-on-one meetings.
-
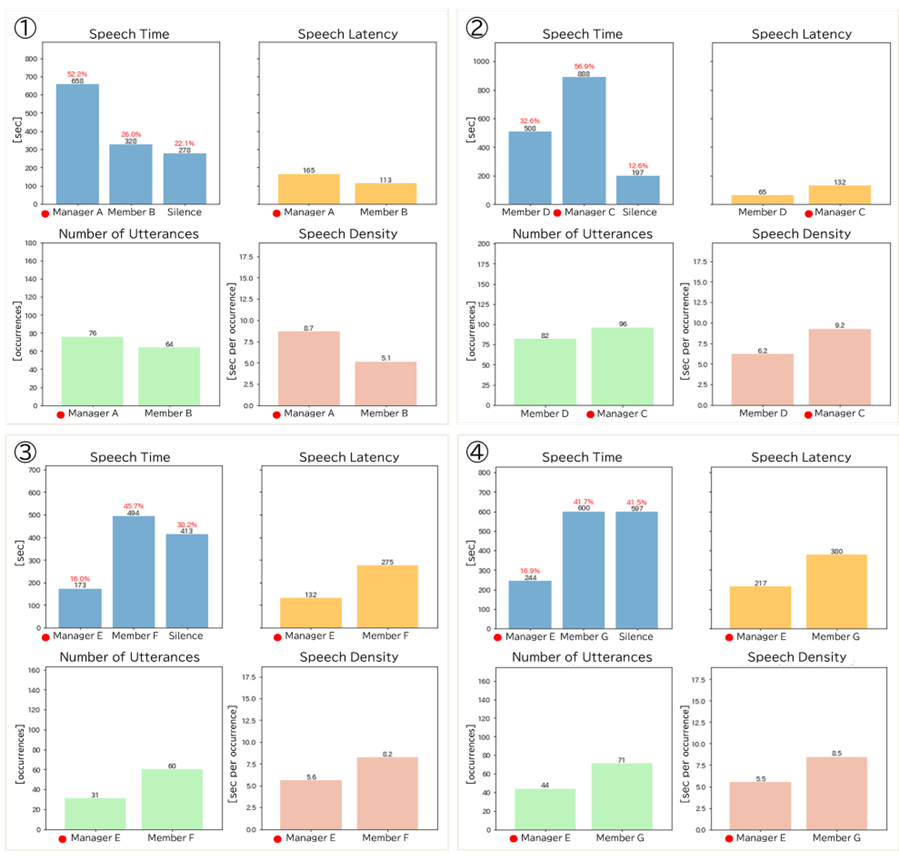
- Figure 6. Communication Between Managers and Members in Four 1-on-1 Meetings
Top Left: Speech Time, Top Right: Speech Latency†, Bottom Left: Number of Utterances, Bottom Right: Speech Density‡, Red Solid Circle: Manager
(† Time of silence before starting to speak, ‡ Speech time divided by the number of utterances)
- Nagaya
- In cases (1) and (2) in Figure 6, it is evident that the manager spoke more than the member. Generally, it is said that during 1-on-1 meetings, the manager should focus on listening and allow the subordinate to speak as much as possible, with a guideline of 80% subordinate and 20% manager. However, analysis shows that this is not often the case. On the other hand, cases (3) and (4) had the same manager, but they both had less speech than the members, meaning they followed the theory of 1-on-1 meetings. In cases (3) and (4), longer silence times were also characteristic, suggesting that this manager consciously refrained from speaking and was not bothered by silence.
- Did you share these results with the managers?
- Nagaya
- After the project ended, we held explanation sessions for the approximately 100 employees who cooperated, sharing the analysis results of the acquired data by the workplace. When we conveyed the results of the one-on-one meetings, managers who spoke a lot reflected, "I might not have been doing that," while those who spoke less seemed indifferent, saying, "Is that so?"
- I see. Communication analysis can indeed be approached from various angles. Finally, could you tell us about future prospects?
- Mitsuda
- Clarifying the correlation between communication characteristics (such as leadership) and psychological states (positive or negative) with indicators calculable from the Badge System will be a research task. Additionally, the relationship between non-verbal signals and communication is a fascinating academic theme with implications for exploring the origins of sociality, mental health, robotics, and education. We also plan to use the Badge System for measuring the effects of plant greenery in our other articles on this site titled "Genki-KûkanTM."
Authors
Takayuki Nagaya
After joining Toyota Central R&D Labs., Inc. in 1991, he worked on the development of expert systems before engaging in the development of QR codes. His main responsibilities included implementing and evaluating the error correction function of QR codes, as well as developing programs for encoding and decoding the codes. Currently, in addition to analyzing communication using badges, he is involved in research topics related to well-being.
Eiji Mitsuda
He joined Toyota Motor Corporation in 2016. During graduate school, he majored in astrophysics. After working on molecular simulations for material development at Toyota, he was in charge of leading the Badge Project. He has a curious personality that crosses scales from space (parsecs) to molecules (angstroms) to people (meters) as research targets. Currently, he is engaged in management of service science research based on informatics and psychology.
Hikaru Sugata
He joined Toyota Motor Corporation in 2007. During his graduate school years, he majored in Information Science and Engineering (Control Theory). At Toyota, he was involved in R&D and new business planning, including robot development. He is currently seconded to Toyota Ventures in Silicon Valley, where he is working on creating synergies between Toyota and startups with cutting-edge technologies.
References
| *1 | K. Yano, S. Lyubomirsky, and J. Chancellor, Sensing happiness: Can technology make you happy? IEEE Spectrum, pp. 26-31, Dec. 2012. |
|---|---|
| *2 | Open Badges, MIT Media Lab |
| *3 | Oren Lederman, Dana Calacci, Angus MacMullen, Daniel C. Fehder, Fiona E. Murray, and Alex "Sandy" Pentland, 2016. Open Badges: A Low-Cost Toolkit for Measuring Team Communication and Dynamics. SBP-BRiMS, IN_105. |
Contact Information (about this article)
- Frontier Research Center
- frc_pr@mail.toyota.co.jp


