May 24, 2024
Research on Spatial IntelligenceApplication to Cell Production Systems as Living Systems
Toyota Motor Corporation (hereinafter referred to as Toyota)'s Frontier Research Center is conducting Research on Spatial Intelligence as a research project that leads to the future. This research aims to capture the movement of people and objects and the flow of information in space as events, visualize these events, and predict future movements and flows. Currently, the research is being applied in the vehicle prototype factory to verify its effectiveness. The goal is to evolve Research on Spatial Intelligence into a technology that can be utilized in facilities such as homes, hospitals, logistics warehouses, and even within cities. We interviewed Yoshizawa, a member of the team, to learn more about their efforts.
Creating Mobility for All
―Before we dive into the main topic, could you please explain what Research on Spatial Intelligence is and how it can be applied in our daily lives?
- Yoshizawa
- By collecting examples of various events in our daily lives, we can start seeing patterns and discovering insights. For example, the Easy-to-use Map Showing Real-time Traffic Information and Road Closures in Japan,*1 which creates traffic information based on data collected from vehicles through the Data Communication Module (DCM), is an example of Research on Spatial Intelligence. If we can identify unusual events in our daily lives and utilize them for future predictions, it has the potential to contribute to the well-being of individuals and society.
―I see. So, in this research, you are visualizing the movements of people and objects in the process of manufacturing vehicles at the production site and using Research on Spatial Intelligence to predict future movements, correct?
- Yoshizawa
- Yes, exactly. Instead of tackling the complexity of everyday life right away, we decided to focus on the cell production system, which enables flexible car manufacturing*2*3 and refine Research on Spatial Intelligence.
―How does the cell production system for manufacturing vehicles relate to Research on Spatial Intelligence?
- Yoshizawa
- The cell production system is a method in which one or a few workers complete the production process of a product in a line called a "cell." Parts and tools are arranged in a U-shape, and workers assemble the components and complete the product while moving (Figure 1). It is suitable for small-scale production of various models, and Toyota has adopted it in facilities such as the GR Factory.
-
-
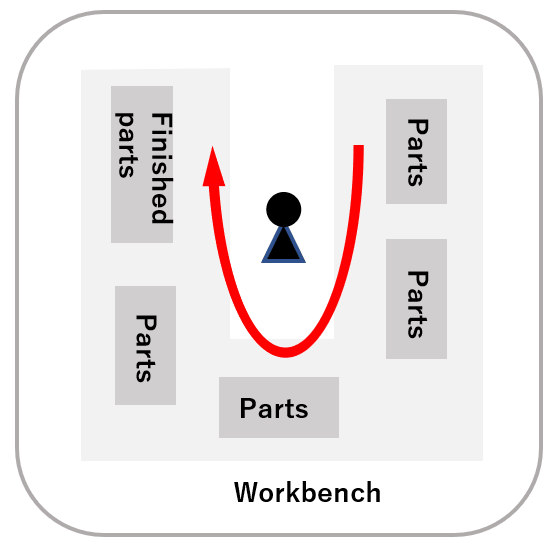
- Figure 1 Typical Cell Production System (U-shaped)
-
-
-
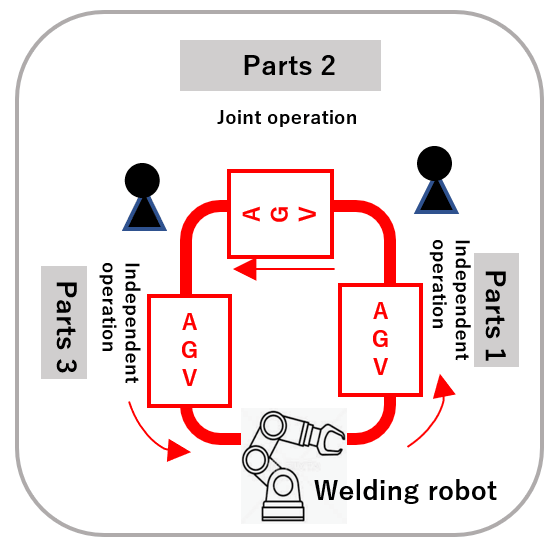
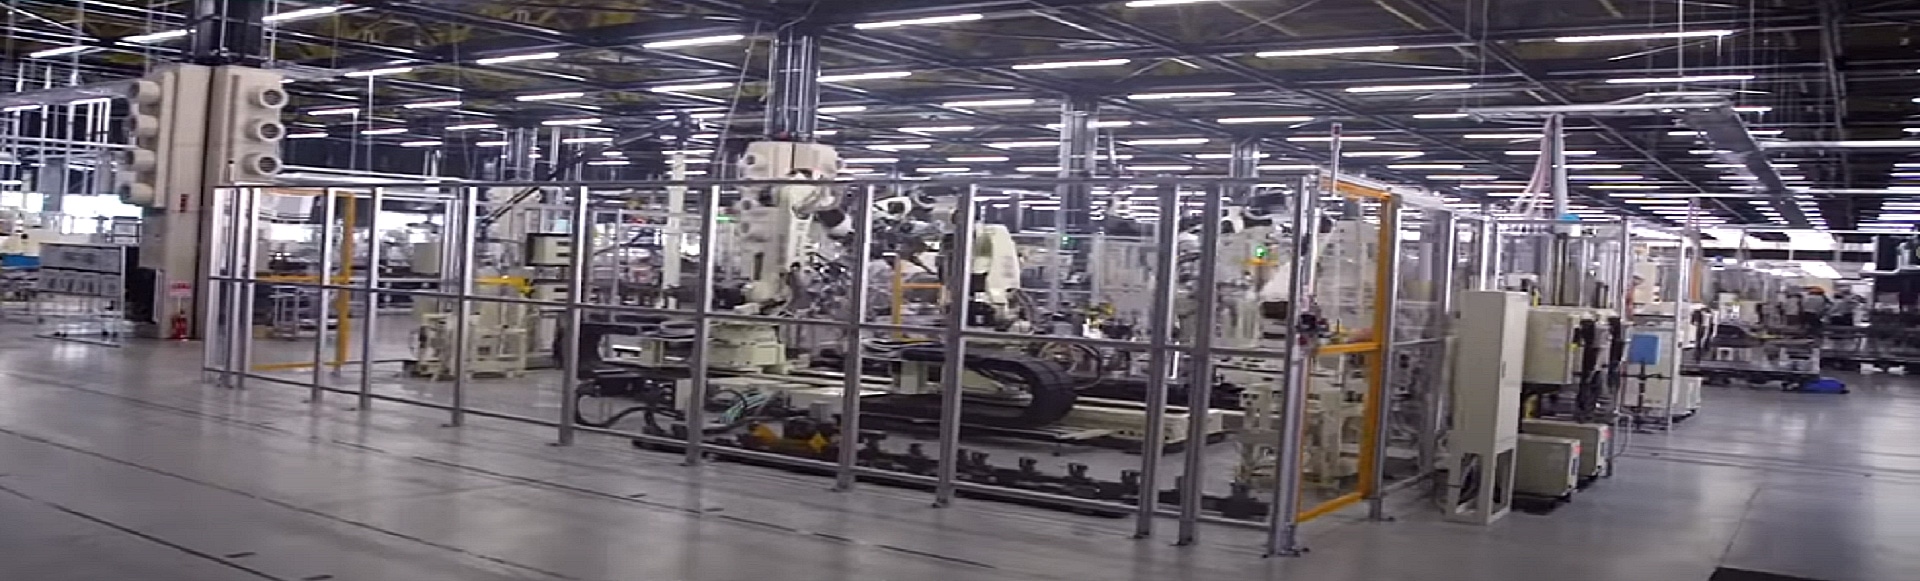
- Figure 2 Cell Production System in the Vehicle Prototype Factory
-
―Is the cell production system in the vehicle prototype factory also U-shaped?
- Yoshizawa
- The cell production system in the vehicle prototype factory is designed differently. As shown in Figure 2, the main parts are transported by an Automatic Guided Vehicle (AGV) that circulates around the workstations. Workers attach sub-parts or welding robots perform welding tasks.
―What are the specific challenges in the cell production system on the production site?
- Yoshizawa
- Compared to normal line production, in the cell production system, workers need to efficiently perform multiple tasks within a long tact time (time spent on manufacturing). If the timing of AGV's arrival at the designated location or the timing of collaborative work with other workers does not align, workers may experience idle time. In the case of improving line production, we measure the work time of each worker with a stopwatch and visualize the production cycle time to identify any waste or delays. However, in the case of the cell production system, multiple events occur simultaneously within the cell, making it difficult to grasp the causes of delays or idle time quantitatively. Moreover, since multiple tasks are assigned to each worker in the cell production system, it requires high skills from the workers, and maintaining a balance of skills among the workers is also a significant challenge. In this research, we focus on challenges caused by multiple simultaneous events and introduce Research on Spatial Intelligence to address them.
Column
The cell production system, based on the Toyota Production System, has been under consideration for over 40 years. Toyota's cell refers to "a collection of workers and production equipment that autonomously and self-sufficiently handles a certain range of process sequences with a certain degree of freedom and autonomy." The cell production system is a "production system composed of multiple cells cooperating with each other." The autonomy of the production system refers to "expanding the scope of management and control performed by the production subjects themselves.*2"
―To solve the challenges arising from multiple simultaneous events, how did you proceed?
- Yoshizawa
- First, we developed an analysis method based on the concept of "Digital Twin Double Loop."
-
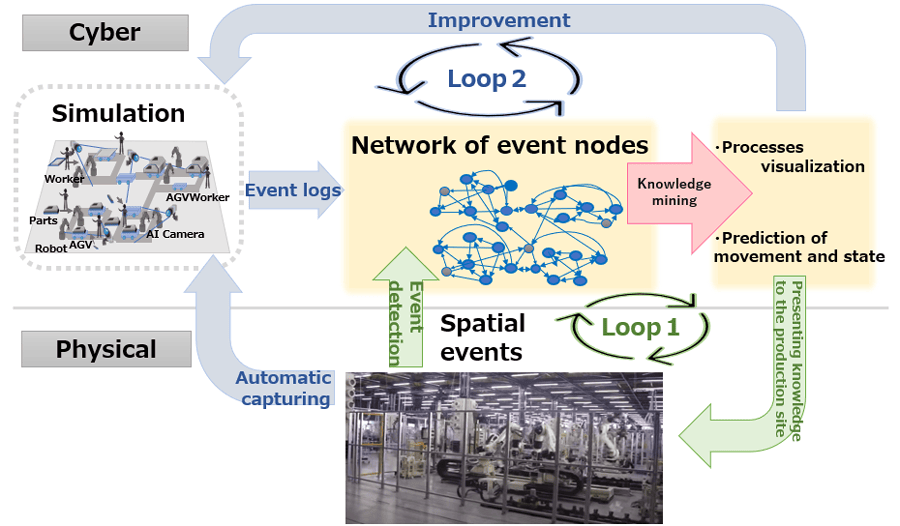
- Figure 3 Digital Twin Double Loop
―When you mention "Digital Twin," I imagine a two-way reflection of improvements made in the digital world being applied to the real world. What exactly does the "Double Loop" refer to?
- Yoshizawa
Please refer to Figure 3. First, in contrast to the physical site, we reproduce (hereinafter referred to as capture) the site in the cyberspace. Then, a "network of event nodes" is introduced to get a bird's eye view of the complex process.
With respect to double loops, as for the first loop (a green-colored loop in Figure 3), in the physical site, we detect events that occur within the cell using multiple overhead cameras and create a network of event nodes. From this network, we discover insights (such as delay facts and causes) and present them to the production site.
The second loop (the blue-colored loop in Figure 3) captures the shape and movement of the physical site in the cyberspace and simulates the site's movement. Since the simulation can generate event logs, a network of event nodes is created from these to discover insights. The event logs are then returned to the simulation. The insights gained in cyberspace are also presented to the production site.
―The network of event nodes serves as a hub for the two loops. Just by looking at Figure 3, I can see that there were various technological challenges.
- Yoshizawa
Yes, you are right. Even automatically generating a network of event nodes was a challenge, as well as analyzing the network to extract insights and visualizing them back to the production site or simulation. These were all part of our challenges and the unique aspects of our Research on Spatial Intelligence.
We will share three examples of our efforts: detecting work events, automatic capturing of the production site, and discovering insights.
- Detecting Work Events
―What exactly is the detection of work events?
- Yoshizawa
- It involves detecting what tasks the workers and AGVs are performing and in what state they are. Please refer to Figure 2 again. In the cell production system, for example, when the AGV arrives in front of a worker, the worker uses the AGV as a workstation to set up parts for welding or prepare to transfer welded parts to the next process. In other words, if the worker and the AGV are together at the designated location for the designated time, it means that the designated work has been performed. To understand which tasks are being performed within the cell, we need to be able to detect the movements of the workers and AGVs (location and time).
―How do you detect work events from the movements of workers and AGVs?
- Yoshizawa
- First, we determine the bounding boxes (regions that enclose the objects in an image) for the workers and AGVs. By detecting the movements of the workers and AGVs using cameras, if the bounding boxes of the worker and AGV overlap for a sufficient amount of time, we consider that the designated task has occurred (Figure 4).
-
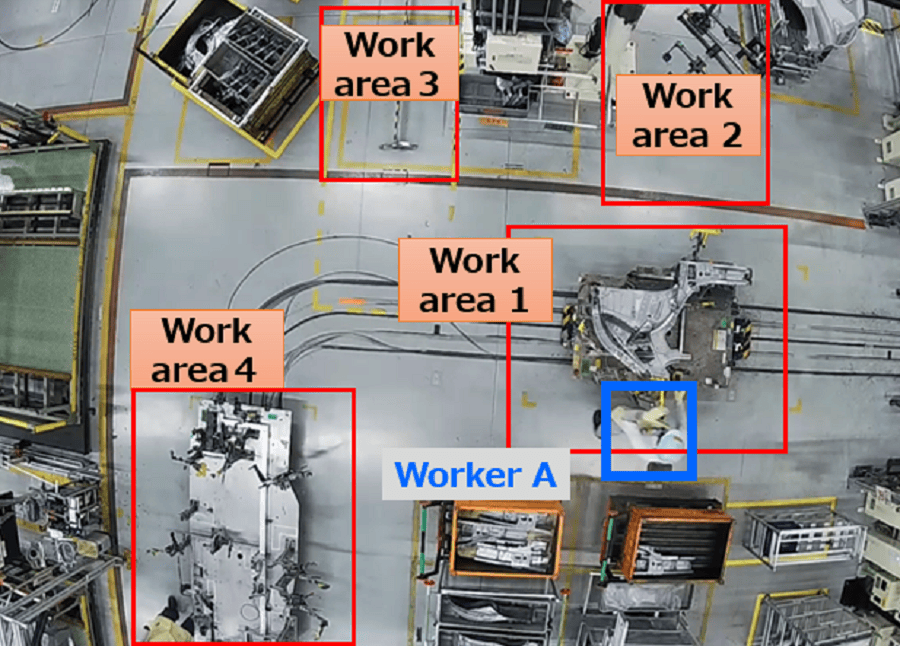
- Figure 4 Event Detection Example in the Vehicle Prototype Factory
For example, if an AGV arrives at Work Area 1 and the bounding boxes of the AGV (red box) and worker A (blue box) overlap for a certain amount of time, it is considered that Work Area 1 is active.
Since the work areas are predetermined, we assign names to the work areas such as S11-S29 (individual tasks) and K1-K3 (collaborative tasks). We then display the movements of the workers and AGVs captured by the cameras on a Gantt chart (vertical axis: work areas, horizontal axis: seconds) to visualize them (Figure 5).
-
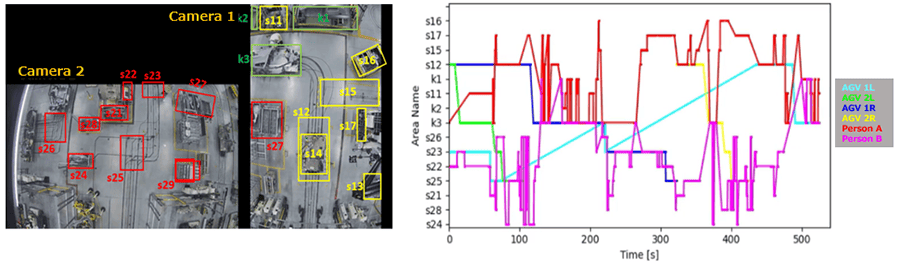
- Figure 5 Gantt Chart in the Vehicle Prototype Factory
This Gantt chart presents normal movements. By creating a Gantt chart for each cycle, we can easily identify where abnormalities occurred if they happen.
―I see. By visualizing the simultaneous movements of workers and AGVs within the cell, you can understand the complexity of their movements and identify any bottlenecks.
- Automatic Capturing of the Production Site
―The left photo in Figure 6 shows the result of capturing the production site with multiple cameras. It seems that the movements of the AGVs and workers are difficult to discern in areas where the images overlap, such as S27 being captured by both Camera 1 and Camera 2.
- Yoshizawa
Yes, that's correct. We are also conducting research on stitching together images from multiple cameras. This research is called Image Stitching, and it is a hot research field. The ceiling cameras in this vehicle prototype factory are positioned to look straight down, but in cases where they are not directly above, i.e., when there are distorted images from multiple cameras, we are working on developing techniques to stitch them into a single image with minimal distortion.
By combining the stitched video of the production site with the previously mentioned Gantt chart, we can easily understand what is happening on the production site as a continuous flow and quantitatively grasp the situation.
-
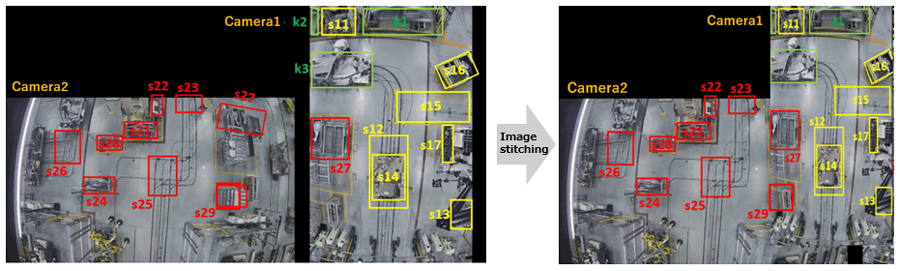
- Figure 6 Image Stitching
- Discovering Insights
―And finally, discovering insights. How do you discover insights from the network of event nodes?
- Yoshizawa
- There is a method of analysis*4 called "Process Mining" to discover, monitor, and improve actual processes by collecting event logs and extracting insights from the event logs. In fact, process mining research has been advancing in Europe and the United States for several years now.
―How did you utilize process mining to discover insights for the cell production system in this case?
- Yoshizawa
- I will share two examples of use. The first one is the utilization of process mining when creating a network of event nodes from event logs. Please refer to Figure 7 (right). We extract all the events of workers and AGVs from the event logs (blue nodes). In the network representation, we can see the order in which the events occur, but not when they occur. To visualize the timing of the events on the network, we create yellow balls that smoothly move on the network using process mining methods. We understand that an event occurs when a yellow ball overlaps with a blue node. By observing the yellow balls moving between the blue nodes, we can see the progress of the actual work (Video 1).
-
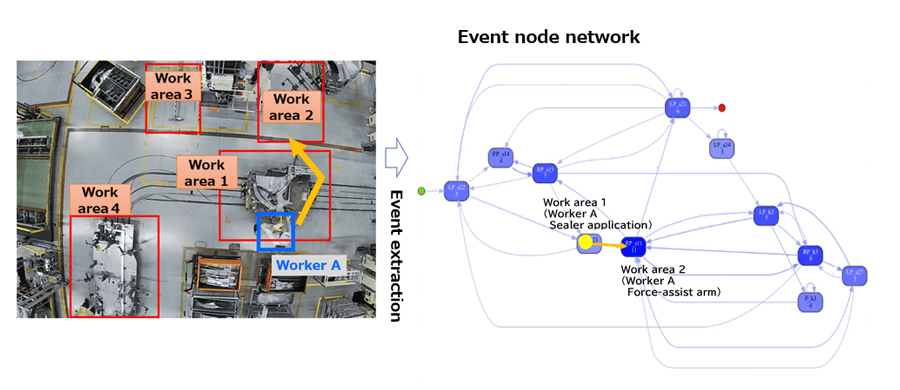
- Figure 7 Network of Event Nodes in the Vehicle Prototype Factory
- Video 1 Event Log
―If we consider the yellow balls as vehicles, it looks like traffic flow.
- Yoshizawa
- Yes, exactly. Creating a network of event nodes from event logs can be interpreted as a flow. For example, we can apply existing traffic flow analysis and discover insights from analyzing the flow. Furthermore, by analyzing this network, we can visualize the workload of each worker, how workers utilize idle time, and so on. In fact, depending on the analysis, we can even understand the skill balance among collaborative workers.
―Please tell us about the second example of use.
- Yoshizawa
- In fact, the previously mentioned process mining did not fully utilize spatial information. Therefore, we have implemented spatial coordinate information into the event nodes to narrow down the analysis target spatially. We named this technique "Spatial Process Mining" and are conducting research on it (Figure 8).
-
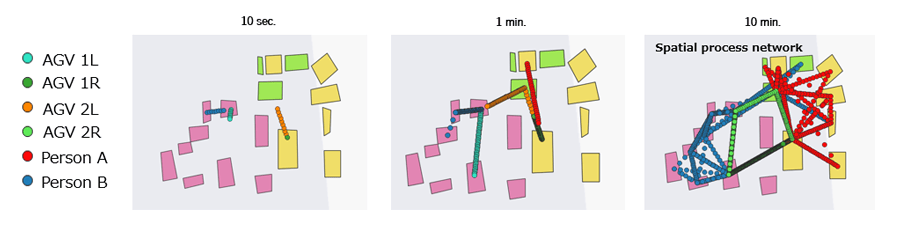
- Figure 8 Spatial Process Network in the Vehicle Prototype Factory
The yellow area represents the work area of Person A, the pink area represents the work area of Person B, and the yellow-green area represents the collaborative work area of Person A and Person B. The movements of Person A, Person B, and AGV1R can be understood within each time frame.
―With spatial process mining, you were able to visualize the movements on the production site. How did you discover insights from there?
- Yoshizawa
- In the case of the cell production system, the network of event nodes tends to be complex. However, by repeatedly representing a series of processes with a network, we can identify areas where the network changes drastically and areas where it remains stable. We believe new insights can be gained by focusing on the stable areas.
Future Perspectives
―In this case, you visualized the process of the cell production system. Are there any efforts to use Artificial Intelligence (AI) to solve the challenges that arise?
- Yoshizawa
- Generic AI has been rapidly developing in recent years. However, in production environments where humans and machines collaborate, there are still many challenges that AI cannot solve. Therefore, we want to leverage Research on Spatial Intelligence to achieve flexible and lifelike systems that are driven by humans.
―The terms "cell" and "life" came up earlier, and Research on Spatial Intelligence seems almost like a living entity. Could you tell us about your enthusiasm for the future?
- Yoshizawa
- There is a manga called "Cells at Work!" where the cells in the human body are anthropomorphized. Although the cell production system cannot be compared to the complexity of life systems, I feel the characteristics of life systems, such as flexible responses to change and resilient self-integration, within the cell production system. By searching for hints for a mobility society while feeling these characteristics, I would like to continue our Research on Spatial Intelligence. There should be various levels of events to be detected, and we want to take on the challenge of multi-scale spatial and temporal information by adjusting the resolution of time and space accordingly.
-
- Figure 9 Research on Spatial Intelligence Team Members
The author is second from the left in the front row.
Author
Shintaro Yoshizawa
Spatial Cognitive Robotics Group, R-Frontier Division, Frontier Research Center, Toyota Motor Corporation
References
| *1 | Toyota Provides Easy-to-use Map Showing Real-time Traffic Information and Road Closures in Japan https://www.toyota.co.jp/jpn/auto/passable_route/map/ (Japanese only) |
|---|---|
| *2 | Chikako Shinobu (2017). "Autonomy and Integration of Cell Production Systems: A Case of Toyota Development and Prototype Factory", Bunshin-do. |
| *3 | GR FACTORY Virtual TOUR - Virtual Factory Tour (Japanese only) |
| *4 | Wil van der Aalst. "Process Mining: Data Science in Action", Springer, 2016. |
Contact Information (about this article)
Frontier Research Center
- frc_pr@mail.toyota.co.jp
RELATED CONTENT
MOST POPULAR